In the Logistic Regression for Machine Learning using Python blog, I have introduced the basic idea of the logistic function. The likelihood, finding the best fit for the sigmoid curve.
We have discussed the cost function. And we also saw two way to of optimization cost function
- Closed-form solution
- Iterative form solution
And in the iterative method, we focus on the Gradient descent optimization method. (An Intuition Behind Gradient Descent using Python).
Now so in this section, we are going to introduce the Maximum Likelihood cost function. And we would like to maximize this cost function.
Maximum Likelihood Cost Function
There are two type of random variable.
- Discrete
- Continuous
The discrete variable that can take a finite number. A discrete variable can separate. For example, a coin toss experiment, only heads or tell will appear. If the dice toss only 1 to 6 value can appear.
A continuous variable example is the height of a man or a woman. Such as 5ft, 5.5ft, 6ft etc.
The random variable whose value determines by a probability distribution.
Let say you have N observation x1, x2, x3,…xN.
For example, each data point represents the height of the person. For these data points, we’ll assume that the data generation process described by a Gaussian (normal) distribution.
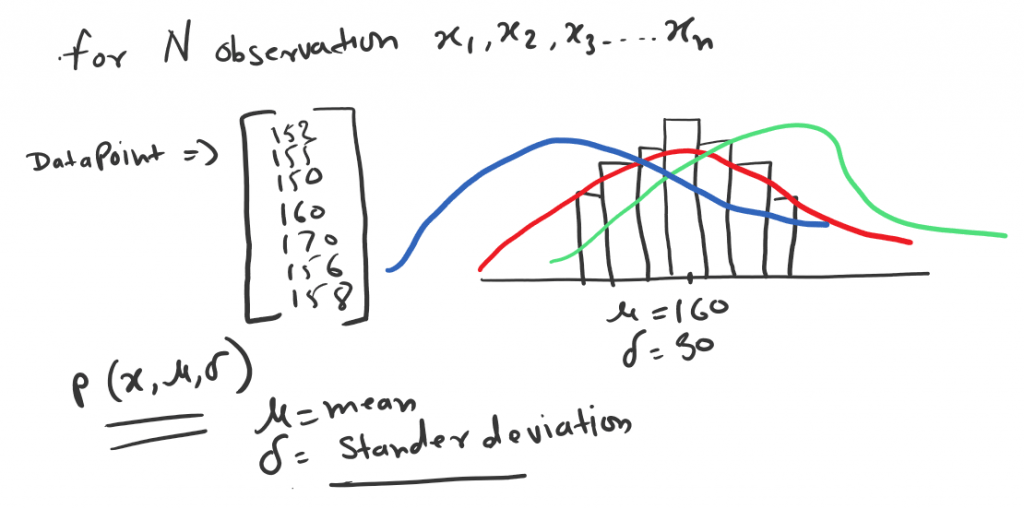
As we know for any Gaussian (Normal) distribution has two-parameter. The mean μ, and the standard deviation σ. So if we minimize or maximize as per need, cost function. We will get the optimized μ and σ.
In the above example Red curve is the best distribution for cost function to maximize.

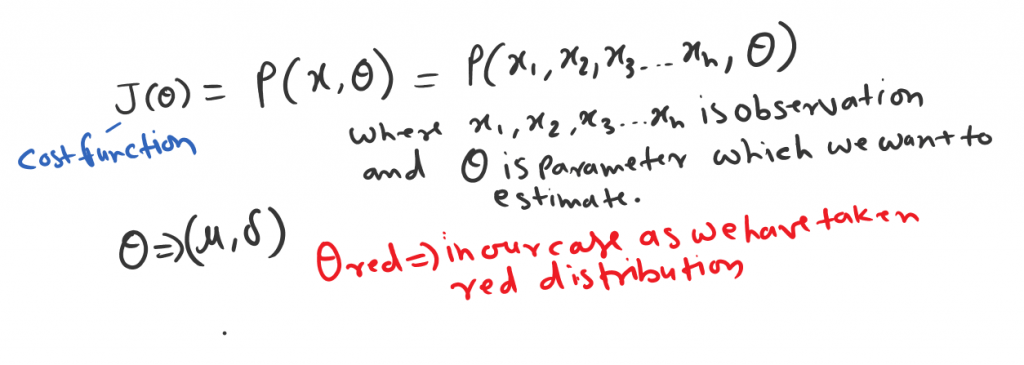
Since we choose Theta Red, so we want the probability should be high for this. We would like to maximize the probability of observation x1, x2, x3, xN, based on the higher probability of theta.
Now once we have this cost function define in terms of θ. In order to simplify we need to add some assumptions.
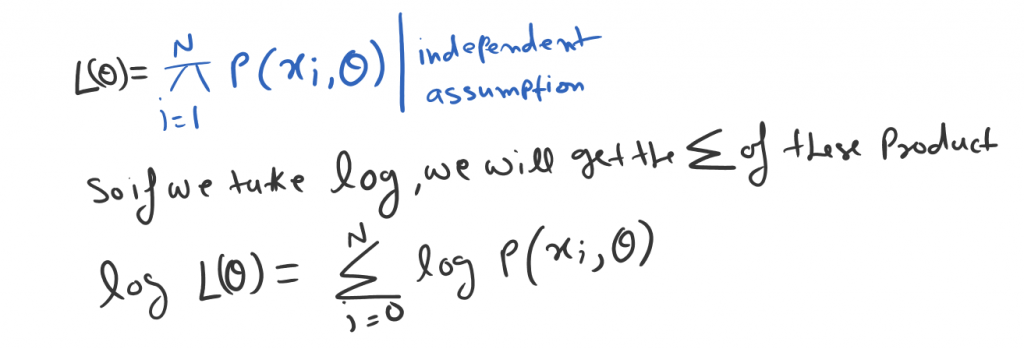
X1, X2, X3… XN are independent. Let say X1,X2,X3,…XN is a joint distribution which means the observation sample is random selection. With this random sampling, we can pick this as product of the cost function.
General Steps
We choose log to simplify the exponential terms into linear form. So in general these three steps used.
- Define the Cost function
- Making the independent assumption
- Taking the log to simplify
So lets follow the all three steps for Gaussian distribution where θ is nothing but μ and σ.
Maximum Likelihood Estimation for Continuous Distributions
MLE technique finds the parameter that maximizes the likelihood of the observation. For example, in a normal (or Gaussian) distribution, the parameters are the mean μ and the standard deviation σ.
For example, we have the age of 1000 random people data, which normally distributed. There is a general thumb rule that nature follows the Gaussian distribution. The central limit theorem plays a gin role but only applies to the large dataset.
The equation of normal distribution or Gaussian distribution is as bellow
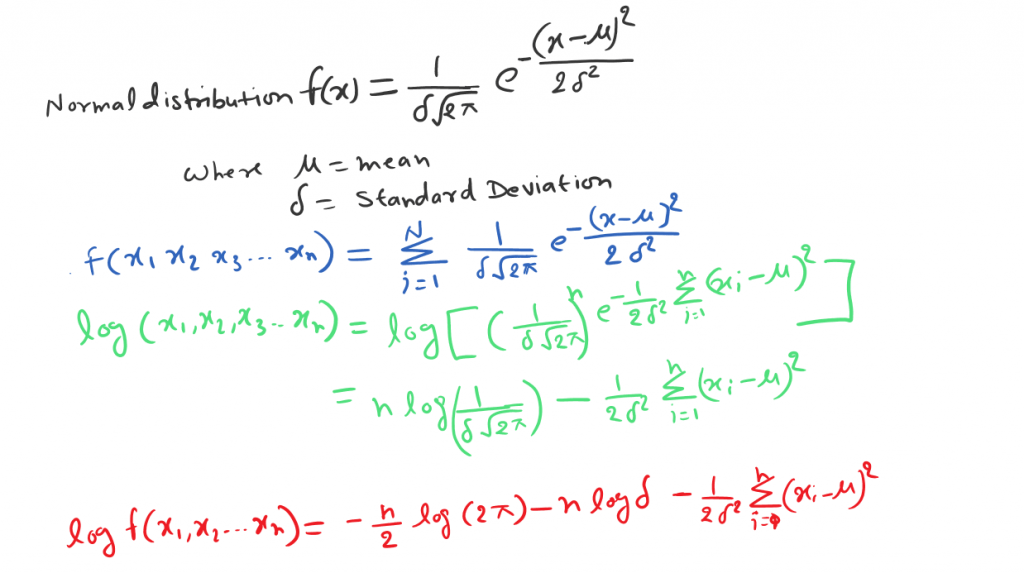
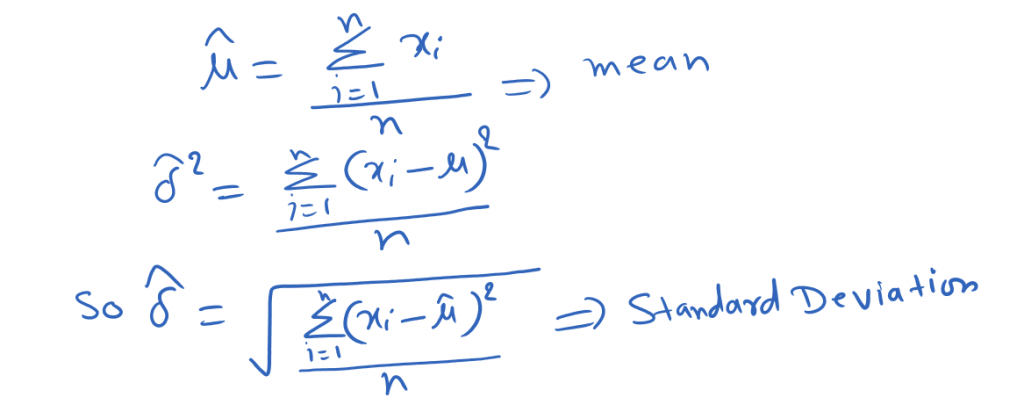
Upon differentiating the log-likelihood function with respect to μ and σ respectively we’ll get the following estimates:
Additional reading
Maximum Likelihood Estimation for Discrete Distributions
The Bernoulli distribution models events with two possible outcomes: either success or failure.
If the probability of Success event is P then the probability of Failure would be (1-P).
The Binary Logistic Regression problem is also a Bernoulli distribution. And thus a Bernoulli distribution will help you understand MLE for logistic regression.
Now lets say we have N desecrate observation {H,T} heads and Tails. So will define the cost function first for Likelihood as bellow:
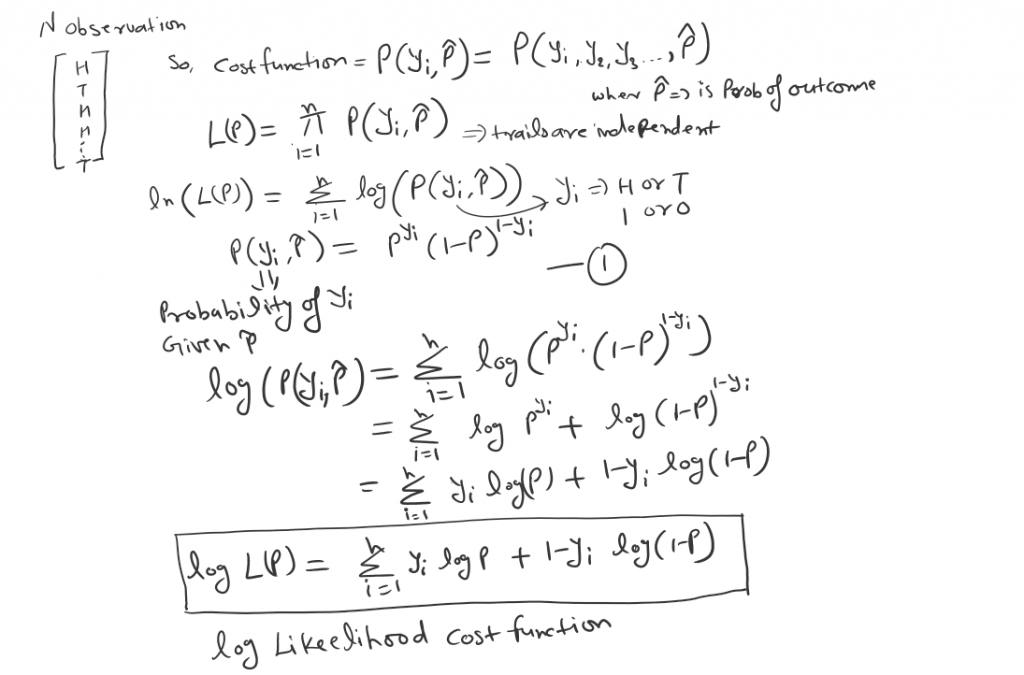
In order do do a close form solution we can deferential and equate to 0.
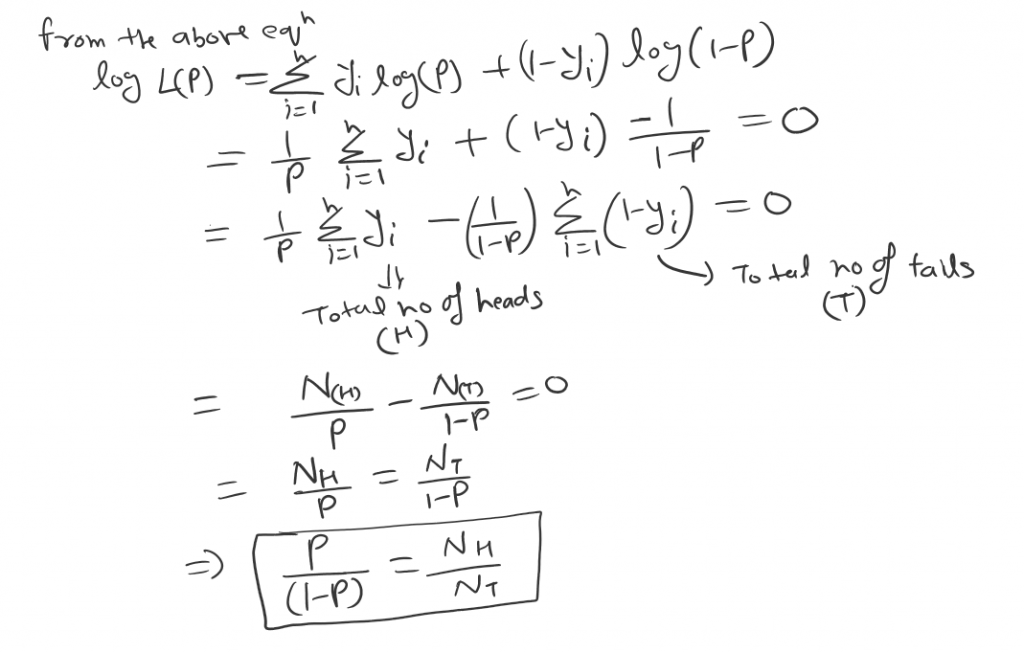
So we got a very intuitive observation hear. The likelihood for p based on X is defined as the joint probability distribution of X1, X2, . . . , Xn.
Now we can say Maximum Likelihood Estimation (MLE) is very general procedure not only for Gaussian. But the observation where the distribution is Desecrate.
Maximum likelihood estimation for Logistic Regression
So let say we have datasets X with m data-points. Now the logistic regression says, that the probability of the outcome can be modeled as bellow.
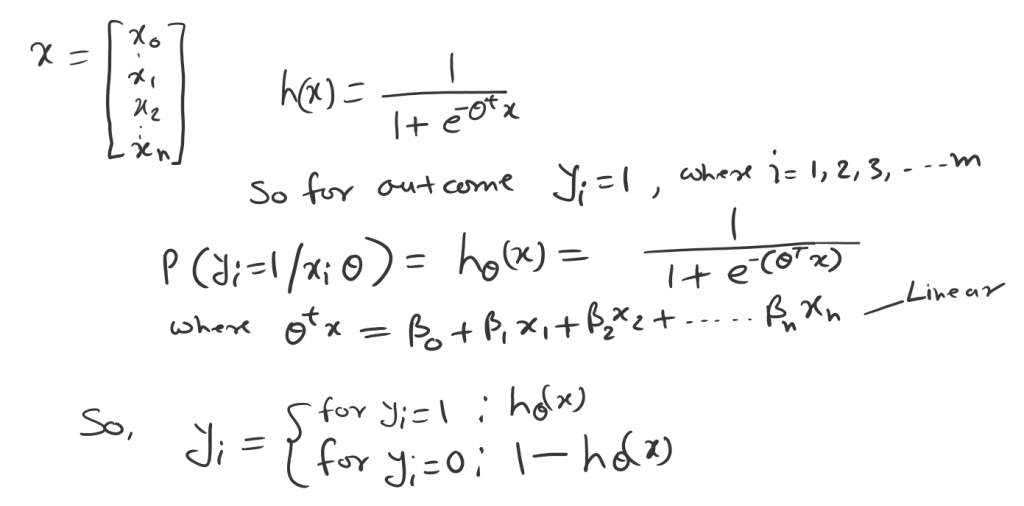
Based on the probability rule. If the success event probability is P than fail event would be (1-P). That’s how the Yi indicates above.
This can be combine into single form as bellow.

Which means, what is the probability of Xi occurring for given Yi value P(x|y).
The likelihood of the entire datasets X is the product of an individual data point. Which means forgiven event (coin toss) H or T. If H probability is P then T probability is (1-P).
So, Likelihood of these two event is.
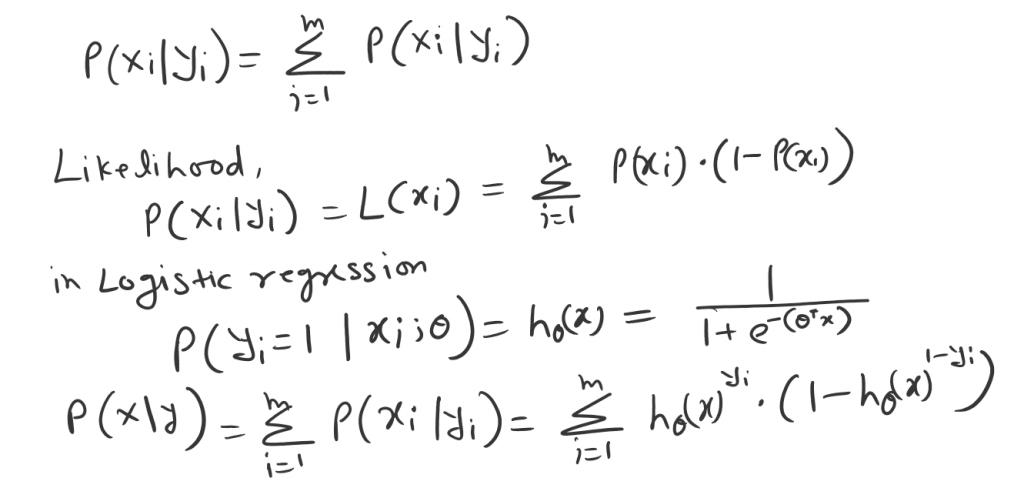
Now the principle of maximum likelihood says. we need to find the probability that maximizes the likelihood P(X|Y). Recall the odds and log-odds.
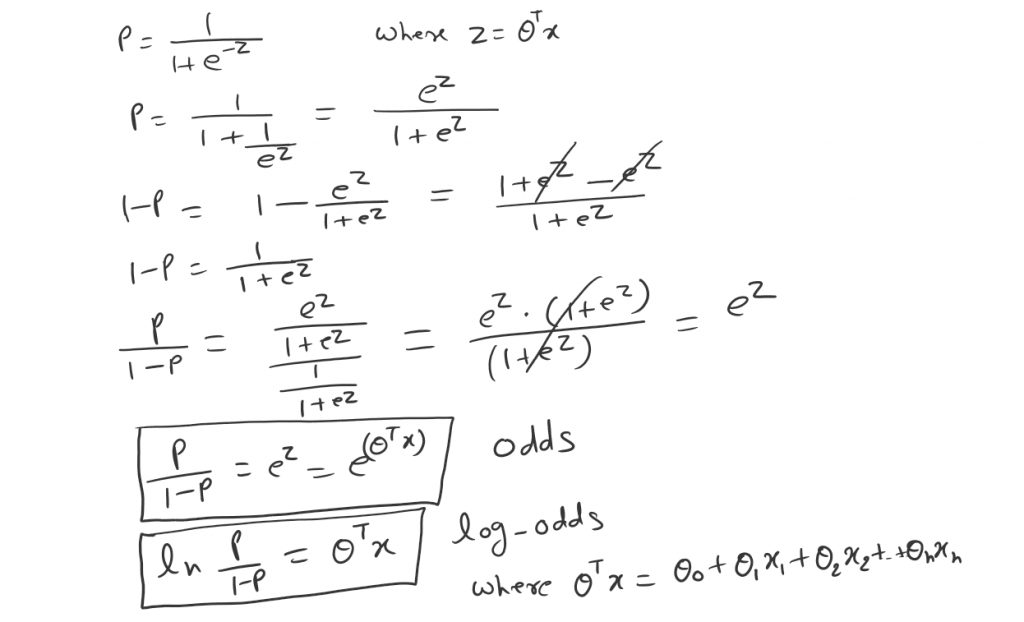
So as we can see now. After taking a log we can end up with linear equation.

So in order to get the parameter θ of hypothesis. We can either maximize the likelihood or minimize the cost function.
Now we can take a log from the above logistic regression likelihood equation. Which will normalize the equation into log-odds.
Now Maximum likelihood estimation (MLE) is as bellow.
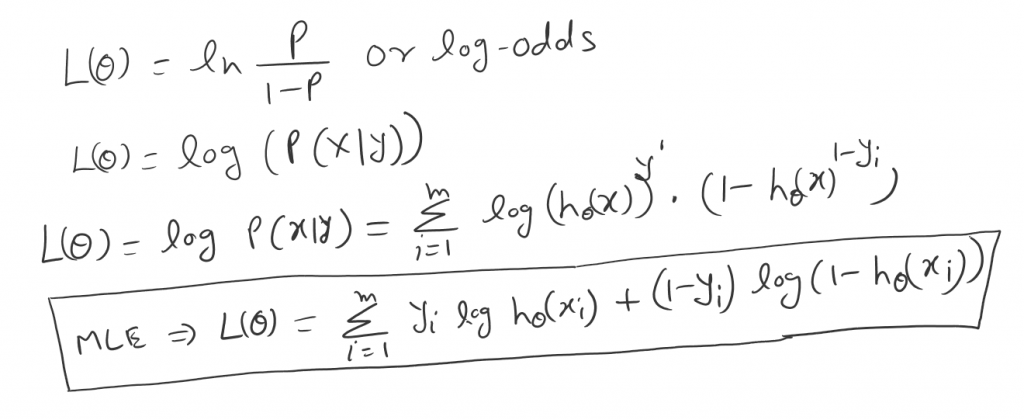

should it be (1-h)^(1-y) and not 1-h^(1-y)
Oh Ya. Thanks to correct.